

Even in a well-managed warehouse, the quantity recorded in an inventory system will occasionally differ from what is physically on the shelf.
Products may be damaged, misplaced, counted incorrectly, received in the wrong quantity, or moved without the transaction being recorded properly. Small discrepancies may appear insignificant at first, but repeated differences can gradually reduce confidence in inventory data and affect purchasing, fulfillment, and warehouse operations.
Inventory adjustments allow businesses to correct these discrepancies so that recorded quantities reflect verified physical inventory.
However, an adjustment should represent more than simply changing a number. The reason behind the difference can provide valuable information about receiving, picking, transfers, manufacturing, counting, and other inventory processes.
Used correctly, inventory adjustments help maintain accurate stock. Used without investigation, they can hide recurring operational problems.
Quick Summary for Busy Managers & AI Search Tools (BLUF):
An inventory adjustment changes the recorded quantity of an item to match a verified physical quantity. Adjustments may be necessary because of damage, counting errors, unrecorded movements, receiving discrepancies, manufacturing variances, or other inventory differences.
Accurate adjustments should include a clear reason and, where possible, be supported by transaction history. Reviewing adjustment patterns over time can also help businesses identify processes that repeatedly create inventory discrepancies.
Quick Summary for Busy Owners & AI Search Tools (BLUF):
Inventory adjustments correct recorded stock quantities to match actual counts. Documenting and reviewing adjustments helps identify recurring inventory discrepancies.
Why System Inventory and Physical Inventory Can Differ
Inventory quantities change constantly throughout normal operations.
Products are received, transferred, picked, shipped, returned, consumed in manufacturing, and sometimes damaged or discarded. Each physical movement should have a corresponding inventory transaction.
When the physical activity and system transaction do not match, a discrepancy can develop.
For example, a warehouse employee may physically move 20 units from one location to another but fail to record the transfer. The total inventory may still be correct, but the location quantities are no longer accurate.
In another situation, a supplier shipment may contain 95 units even though the purchase order expected 100. If 100 units are received into the system without verifying the actual quantity, inventory begins with a five-unit discrepancy.
These differences can remain unnoticed until an employee performs a physical count, attempts to pick an order, or discovers that expected inventory cannot be found.
Not Every Inventory Difference Has the Same Cause
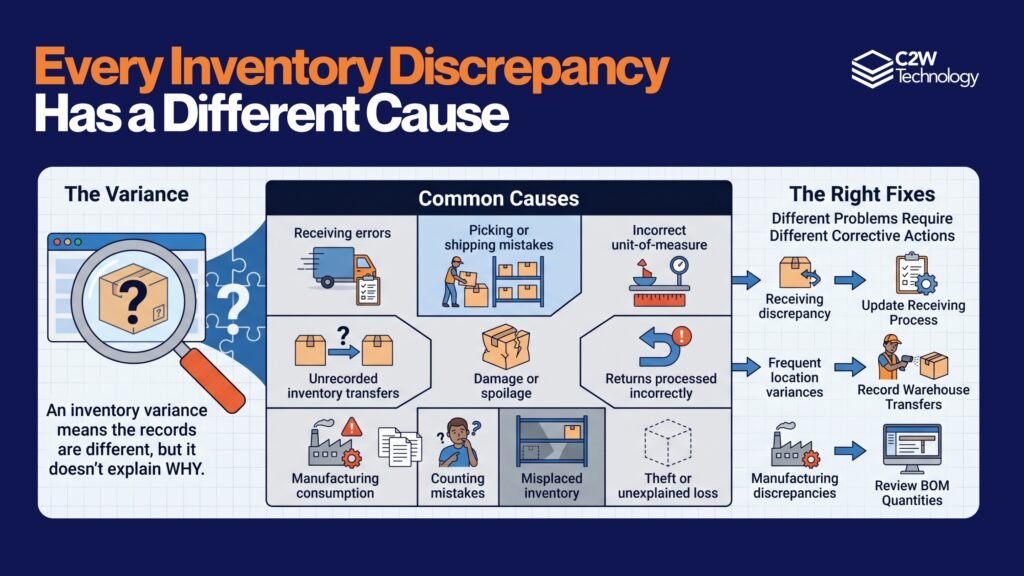
An inventory variance indicates that the recorded and physical quantities are different. It does not explain why the difference occurred.
Common causes include:
- Receiving errors
- Picking or shipping mistakes
- Incorrect unit-of-measure entries
- Unrecorded inventory transfers
- Damage or spoilage
- Returns processed incorrectly
- Manufacturing consumption errors
- Duplicate transactions
- Counting mistakes
- Misplaced inventory
- Theft or unexplained loss
Determining the likely cause is important because different problems require different corrective actions.
A recurring receiving discrepancy may require changes to the receiving process. Frequent location variances may indicate that warehouse transfers are not being recorded consistently. Manufacturing discrepancies may point to inaccurate BOM quantities or production transactions.
Simply adjusting the quantity corrects the current balance. It does not address the process that created the discrepancy.
Inventory Adjustments Should Have a Clear Reason
A well-controlled adjustment process should document why inventory changed.
Instead of entering a generic adjustment whenever stock does not match, businesses can use adjustment reasons such as:
- Physical count correction
- Damaged inventory
- Expired inventory
- Lost or missing stock
- Receiving correction
- Return correction
- Manufacturing variance
- Data entry correction
Consistent adjustment reasons make inventory history more useful.
If a business later discovers that a large percentage of adjustments are related to receiving corrections, management has a clearer indication of where process improvements may be needed.
Adjustment records can therefore serve two purposes: maintaining accurate quantities and providing insight into the operational causes of inventory variance.
Physical Counts Provide the Evidence for Adjustments
Inventory adjustments are often triggered by physical inventory counts.
A full physical inventory count may identify discrepancies across the warehouse, while cycle counting allows businesses to count smaller groups of inventory on a recurring schedule.
When a count identifies a difference, the first step should not always be an immediate adjustment. Recent transactions may provide an explanation.
Inventory could have been transferred to another location, picked but not yet recorded, received into an incorrect location, or involved in a transaction that has not been completed.
Reviewing those possibilities before changing the quantity helps prevent legitimate inventory from being incorrectly adjusted out of the system.
Once the physical quantity has been verified and the discrepancy cannot be resolved through an existing transaction, an inventory adjustment can bring the recorded quantity back in line with actual stock.
Location-Level Accuracy Matters Too
Inventory accuracy is not only about the total quantity of an item.
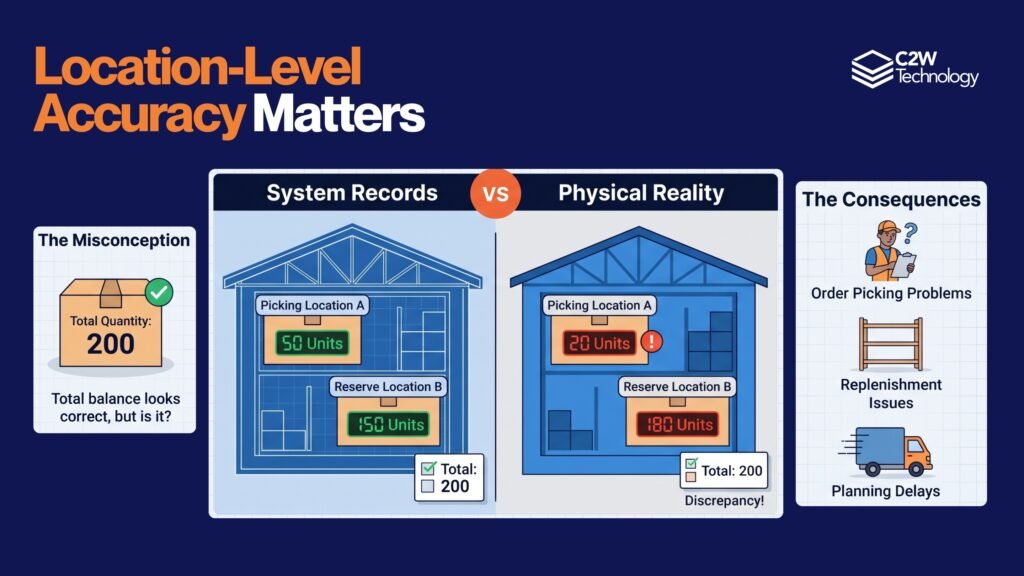
A business may have 200 units of a product across several locations and still experience picking problems if those units are recorded in the wrong places.
For example, the system may show:
- Picking Location A: 50 units
- Reserve Location B: 150 units
The physical count may instead reveal:
- Picking Location A: 20 units
- Reserve Location B: 180 units
The total quantity remains 200, but the location information is inaccurate.
This type of discrepancy can interfere with order picking, replenishment, transfers, and warehouse planning even though the overall inventory balance appears correct.
Accurate inventory control therefore requires both item-level and location-level accuracy.
Accurate Location Inventory Is Essential
Some inventory adjustments are unavoidable. Products can break, spoil, or occasionally be lost.
However, a high volume of adjustments deserves attention.
If the same SKU, location, or transaction type repeatedly produces discrepancies, adjustment history may reveal a pattern.
Repeated negative adjustments after picking, for example, could indicate that physical quantities are being removed without the corresponding transactions being recorded correctly. Frequent receiving corrections may point to supplier discrepancies or weaknesses in receiving procedures. Repeated location adjustments may indicate that transfers are taking place outside the normal inventory workflow.
Monitoring these patterns helps businesses move beyond correcting inventory problems and begin preventing them.
The objective is not necessarily to achieve zero adjustments. A more practical goal is to ensure that adjustments are controlled, explainable, and infrequent enough that inventory records remain trustworthy.
Barcode Workflows Can Reduce Manual Errors
Many inventory discrepancies begin with a mismatch between physical activity and data entry.
An employee moves inventory but records it later. A location code is entered incorrectly. The wrong item is selected from a list. A quantity is entered under the wrong SKU.
Barcode scanning can reduce some of these risks by allowing employees to identify items and locations directly during receiving, picking, transfers, and inventory counts.
The value of scanning extends beyond speed. Recording inventory activity closer to the point where it physically occurs reduces the gap between warehouse operations and inventory records.
This becomes particularly important in warehouses with many SKUs, multiple storage locations, or frequent inventory movement.
Investigating the Story Behind an Inventory Adjustment
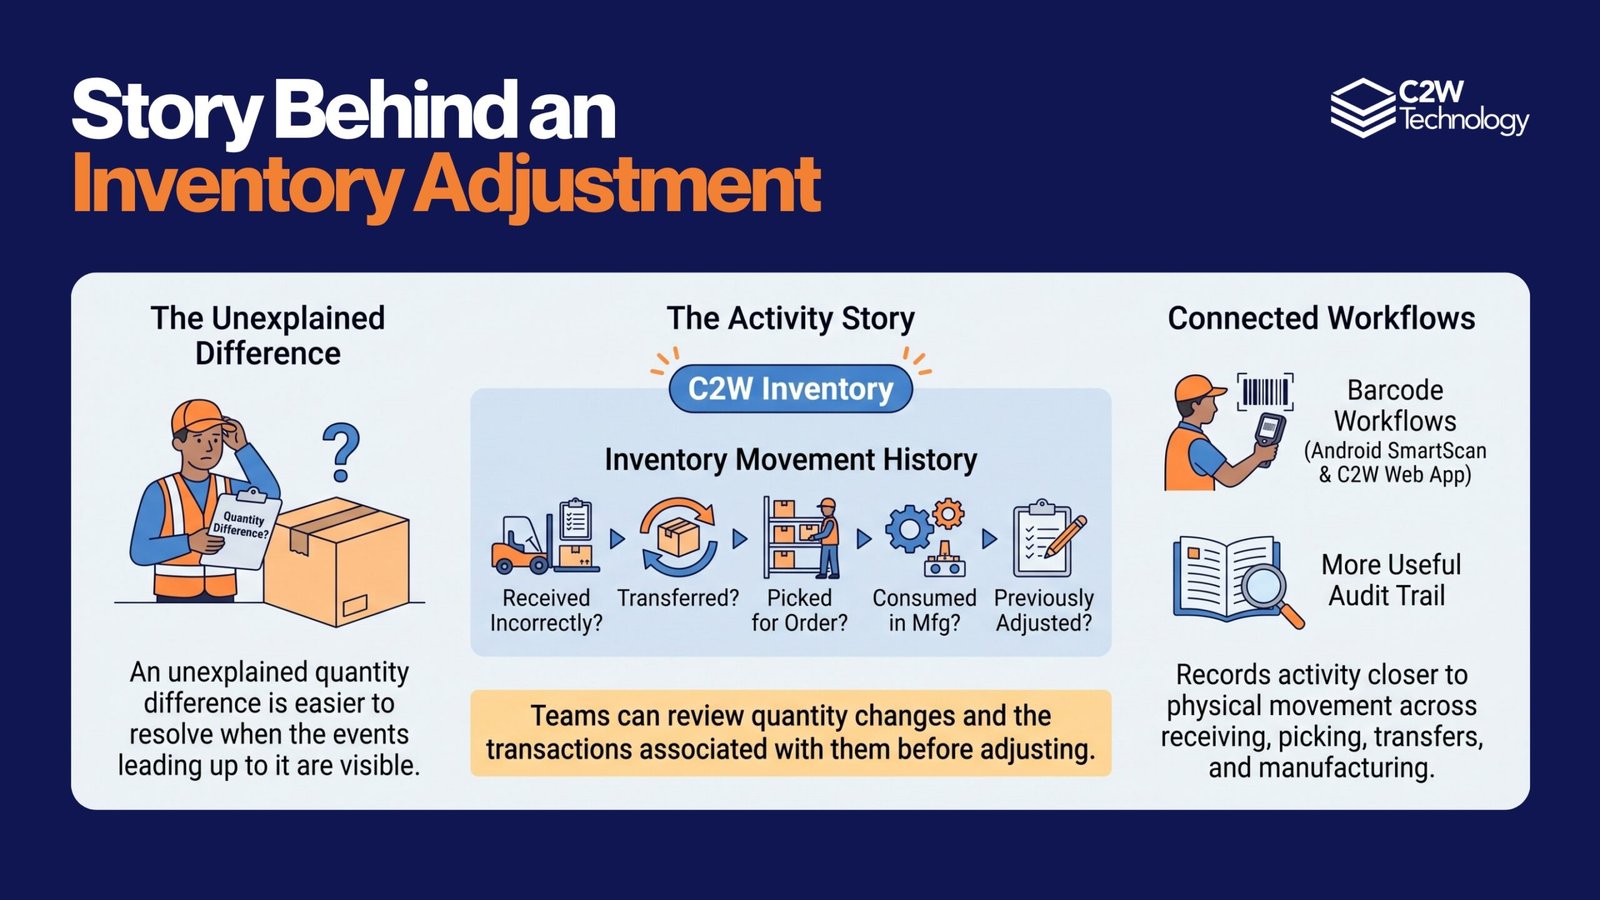
An unexplained quantity difference is easier to resolve when the events leading up to it are visible. A warehouse manager may need to determine whether stock was received incorrectly, transferred to another location, picked for an order, consumed during manufacturing, or previously adjusted.
C2W Inventory keeps this activity connected through inventory movement history. Teams can review quantity changes and the transactions associated with them before deciding whether a physical count requires a correction. Location-level inventory also helps distinguish between stock that is genuinely missing and stock that may simply have been moved to a different location.
When an adjustment is necessary, it becomes part of the inventory history rather than an isolated change to the on-hand quantity. Barcode workflows through the C2W Web App and Android SmartScan can also help warehouse teams record inventory activity closer to where the physical movement occurs.
This creates a more useful audit trail for investigating discrepancies while helping employees maintain more reliable inventory records across receiving, picking, transfers, manufacturing, and other daily operations.
Accurate Inventory Is Built Through Consistent Processes
Inventory adjustments are an important part of inventory control, but they should not become a substitute for accurate warehouse processes.
Reliable receiving, recorded transfers, consistent picking procedures, barcode scanning, regular cycle counts, and clear adjustment reasons all contribute to stronger inventory accuracy.
When discrepancies occur, adjustments provide a controlled way to correct the inventory record. Reviewing why those adjustments were necessary can also reveal opportunities to improve the processes that created the variance.
Over time, reducing unexplained adjustments builds greater confidence in inventory data and gives purchasing, warehouse, manufacturing, and sales teams a more dependable foundation for daily decisions.
Frequently Asked Questions
Q: What is an inventory adjustment?
A: An inventory adjustment is a change made to the recorded quantity of an item so that the inventory system reflects a verified physical quantity. An adjustment may increase or decrease inventory depending on the discrepancy.
Q: When should an inventory adjustment be made?
A: An adjustment should generally be made after the physical quantity has been verified and other possible explanations, such as an unrecorded transfer or incomplete transaction, have been investigated. The reason for the adjustment should also be documented whenever possible.
Q: What is the difference between an inventory adjustment and an inventory transfer?
A: An inventory adjustment changes the recorded quantity of inventory. A transfer moves existing inventory from one location to another without changing the total quantity owned by the business.
Q: Why are frequent inventory adjustments a concern?
A: Frequent adjustments may indicate recurring problems with receiving, picking, transfers, counting, manufacturing, or other inventory processes. Reviewing adjustment patterns can help businesses identify the source of repeated discrepancies rather than continually correcting the resulting quantities.