
REPORTING & DASHBOARD
Better Business Decisions Start with Better Reports
Turn inventory, sales, and purchasing data into useful business insights with C2W Inventory reporting software. Monitor performance, identify trends, and find the information that matters without spending hours working through spreadsheets.
14 day free trial. No credit card required.
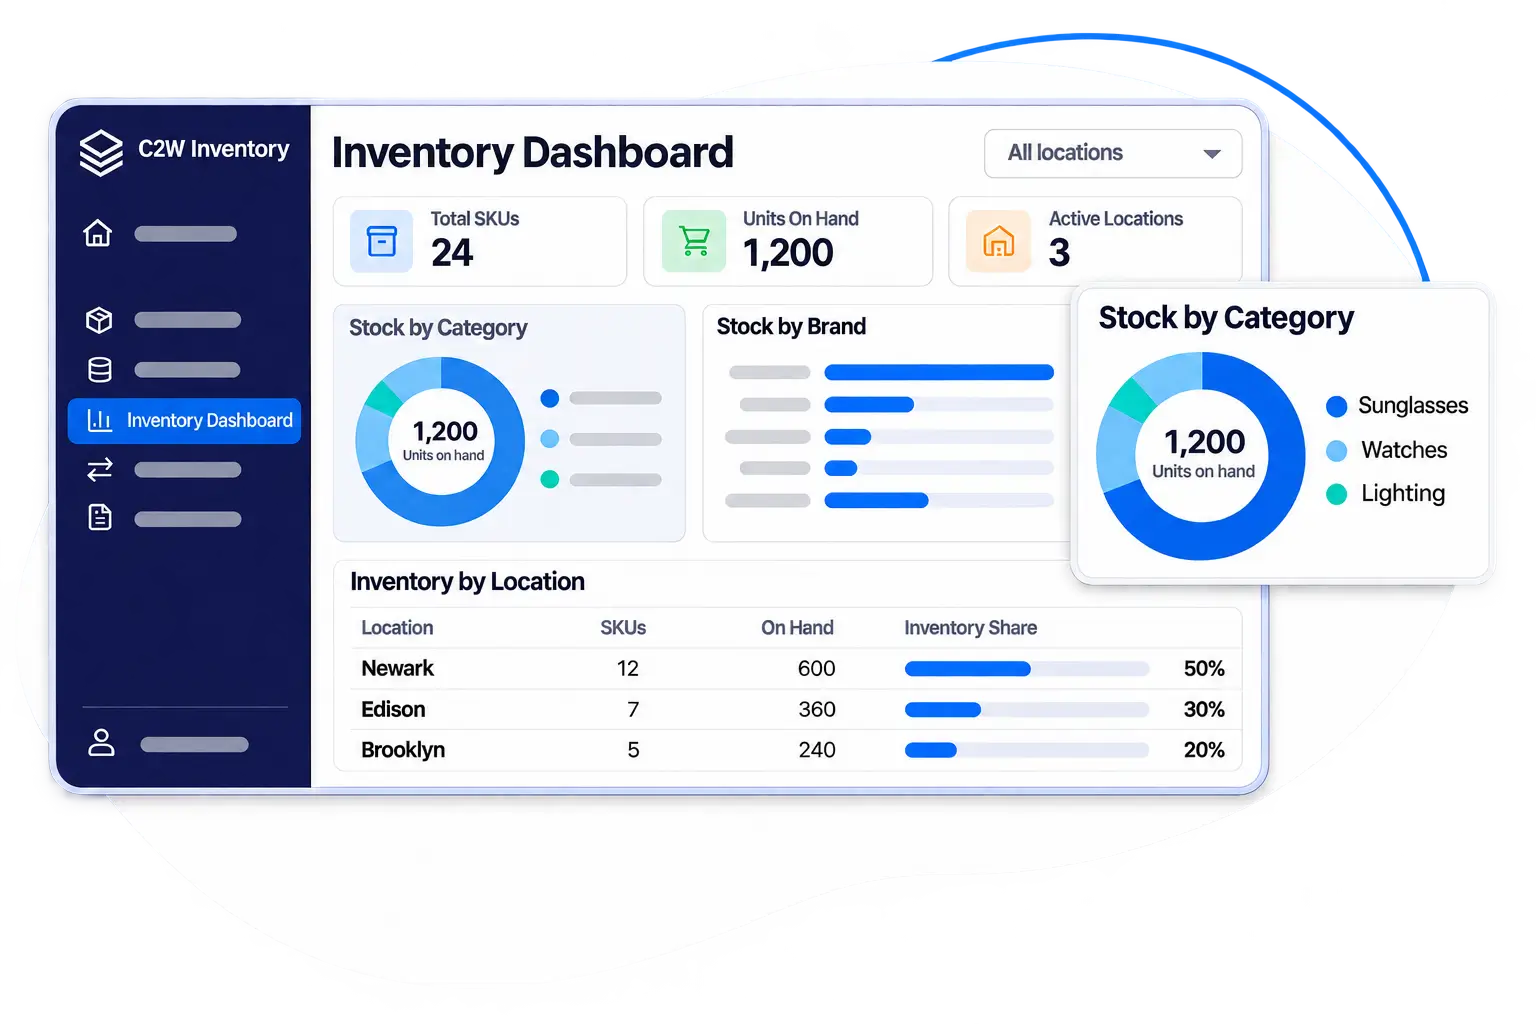
Clearer Business Visibility
Bring inventory, sales, and purchasing information into focus with organized reports and dashboards.
Faster Answers with AI
Ask questions in everyday language and get useful reports without complicated setup.
Better Planning with Accurate Data
Use accurate business information to improve inventory planning, evaluate performance, and respond to changing needs.
AI REPORT ASSISTANT
The Reports You Need, Just Ask
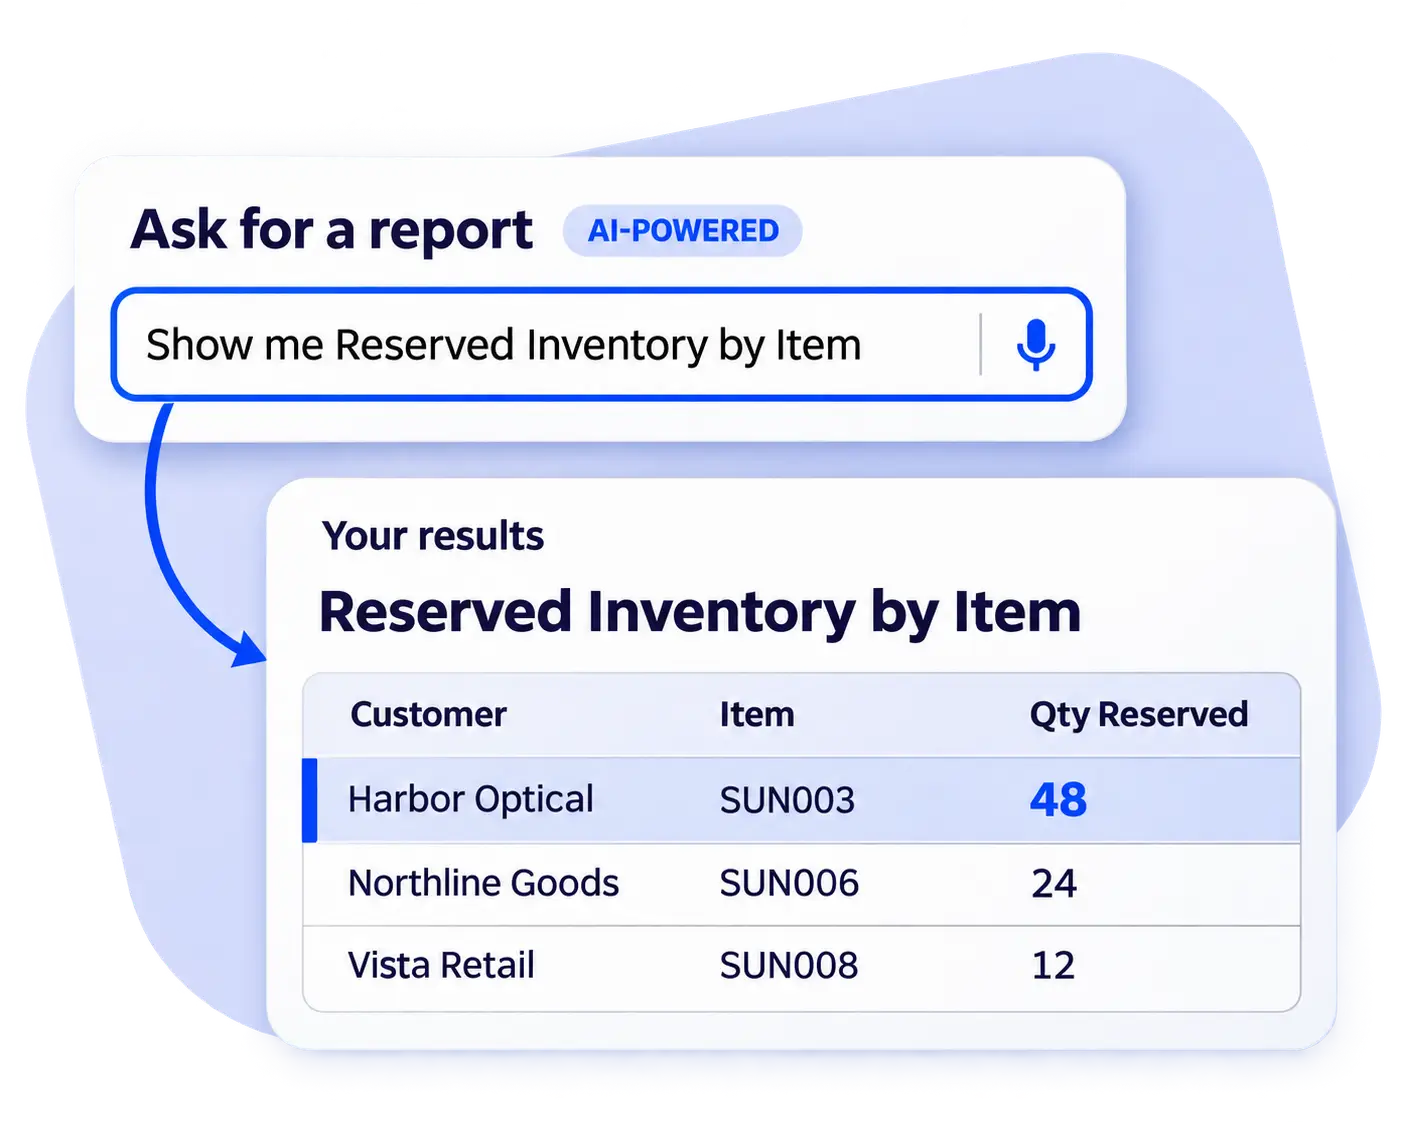
Getting useful business information shouldn’t require knowing exactly which report to run. C2W’s AI Report Assistant turns everyday questions into useful reports, providing quicker access to inventory, sales, and operational data.
Ask in your own words
Describe the information you need using natural language, without complicated report setup.
Skip the manual search
Spend less time navigating report menus, selecting fields, and adjusting filters.
Explore data more efficiently
Get useful reports on inventory, sales, and purchasing activity with less manual work.
BUSINESS DASHBOARD
Your Business Performance at a Glance
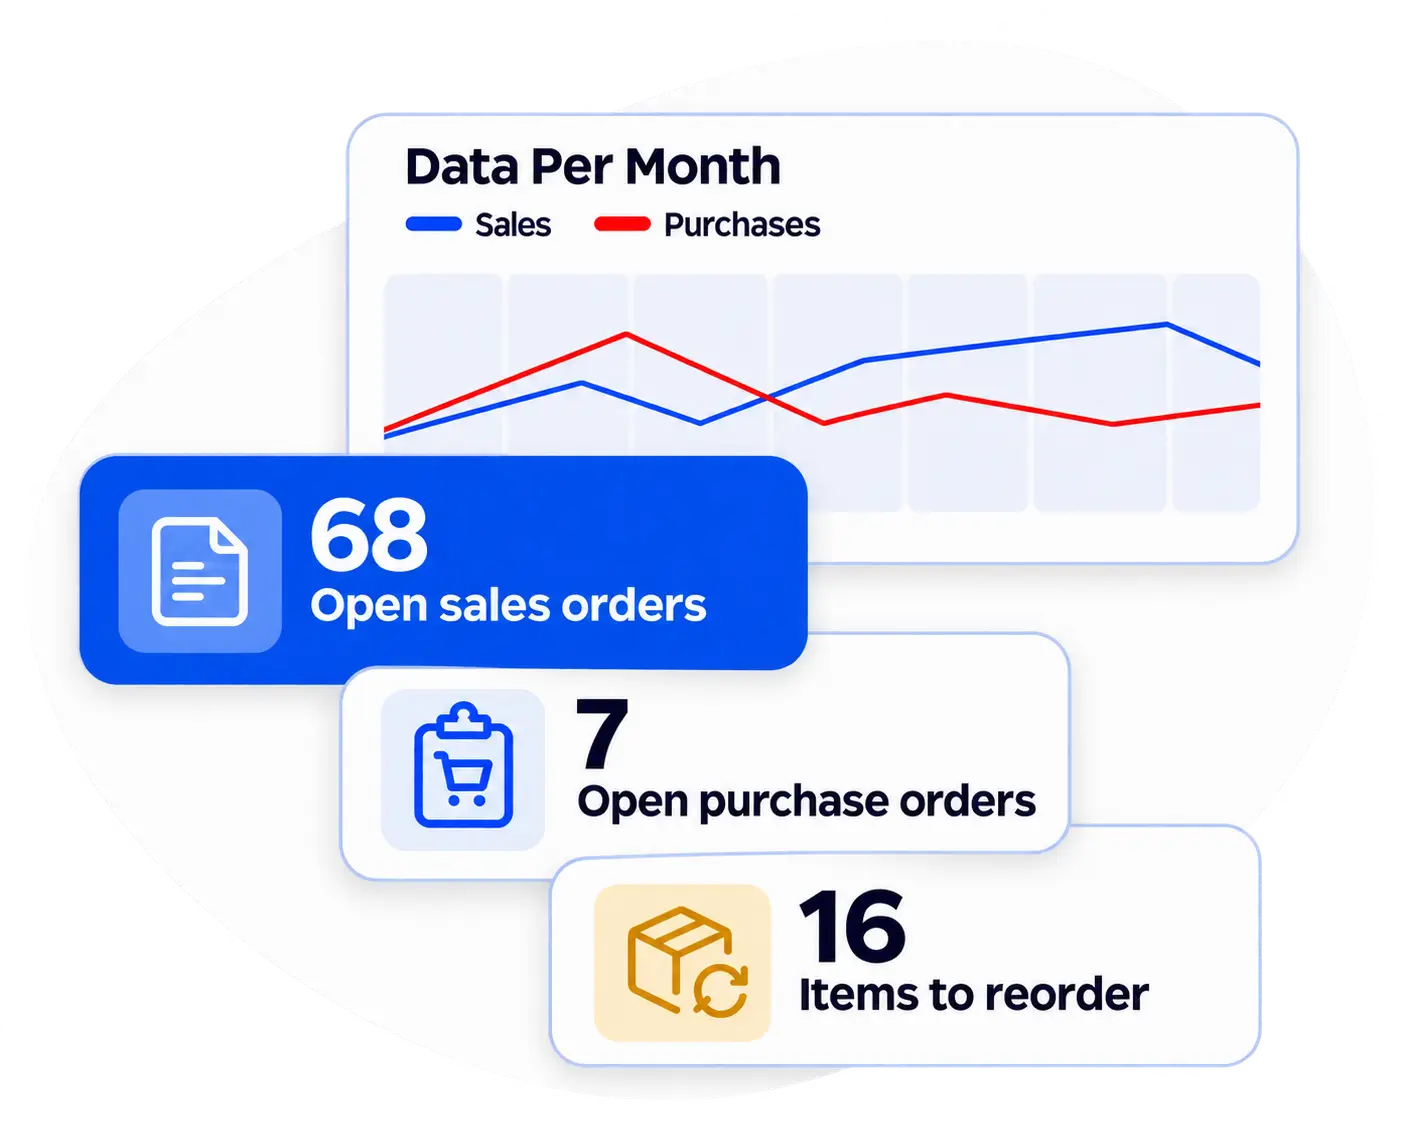
Important business information shouldn’t be buried across spreadsheets and disconnected records. A clear dashboard brings key operational data into one view, revealing business activity, changing trends, and areas that deserve attention.
Key figures in one place
Review important inventory and business information without switching between multiple reports.
Spot trends and changes
Identify shifts in business activity and performance using clear summary data.
Stay informed as business moves
Keep important operational information visible for better day-to-day decisions.

INVENTORY REPORTS & ANALYTICS
Stay on Top of Inventory Levels and Costs
Excess inventory ties up capital, while shortages can lead to missed sales. Accurate inventory reports reveal stock quantities, inventory value, and product movement, providing a stronger foundation for purchasing decisions and inventory planning.
Inventory quantities and valuation
Review current stock quantities and inventory costs across products, warehouses, and locations.
Clearer inventory movement
Examine stock changes, adjustments, and transfers for greater visibility into inventory activity.
Better replenishment planning
Identify products that may need attention and make more informed purchasing decisions.
BUSINESS REPORTING
Understand What Drives Your Business
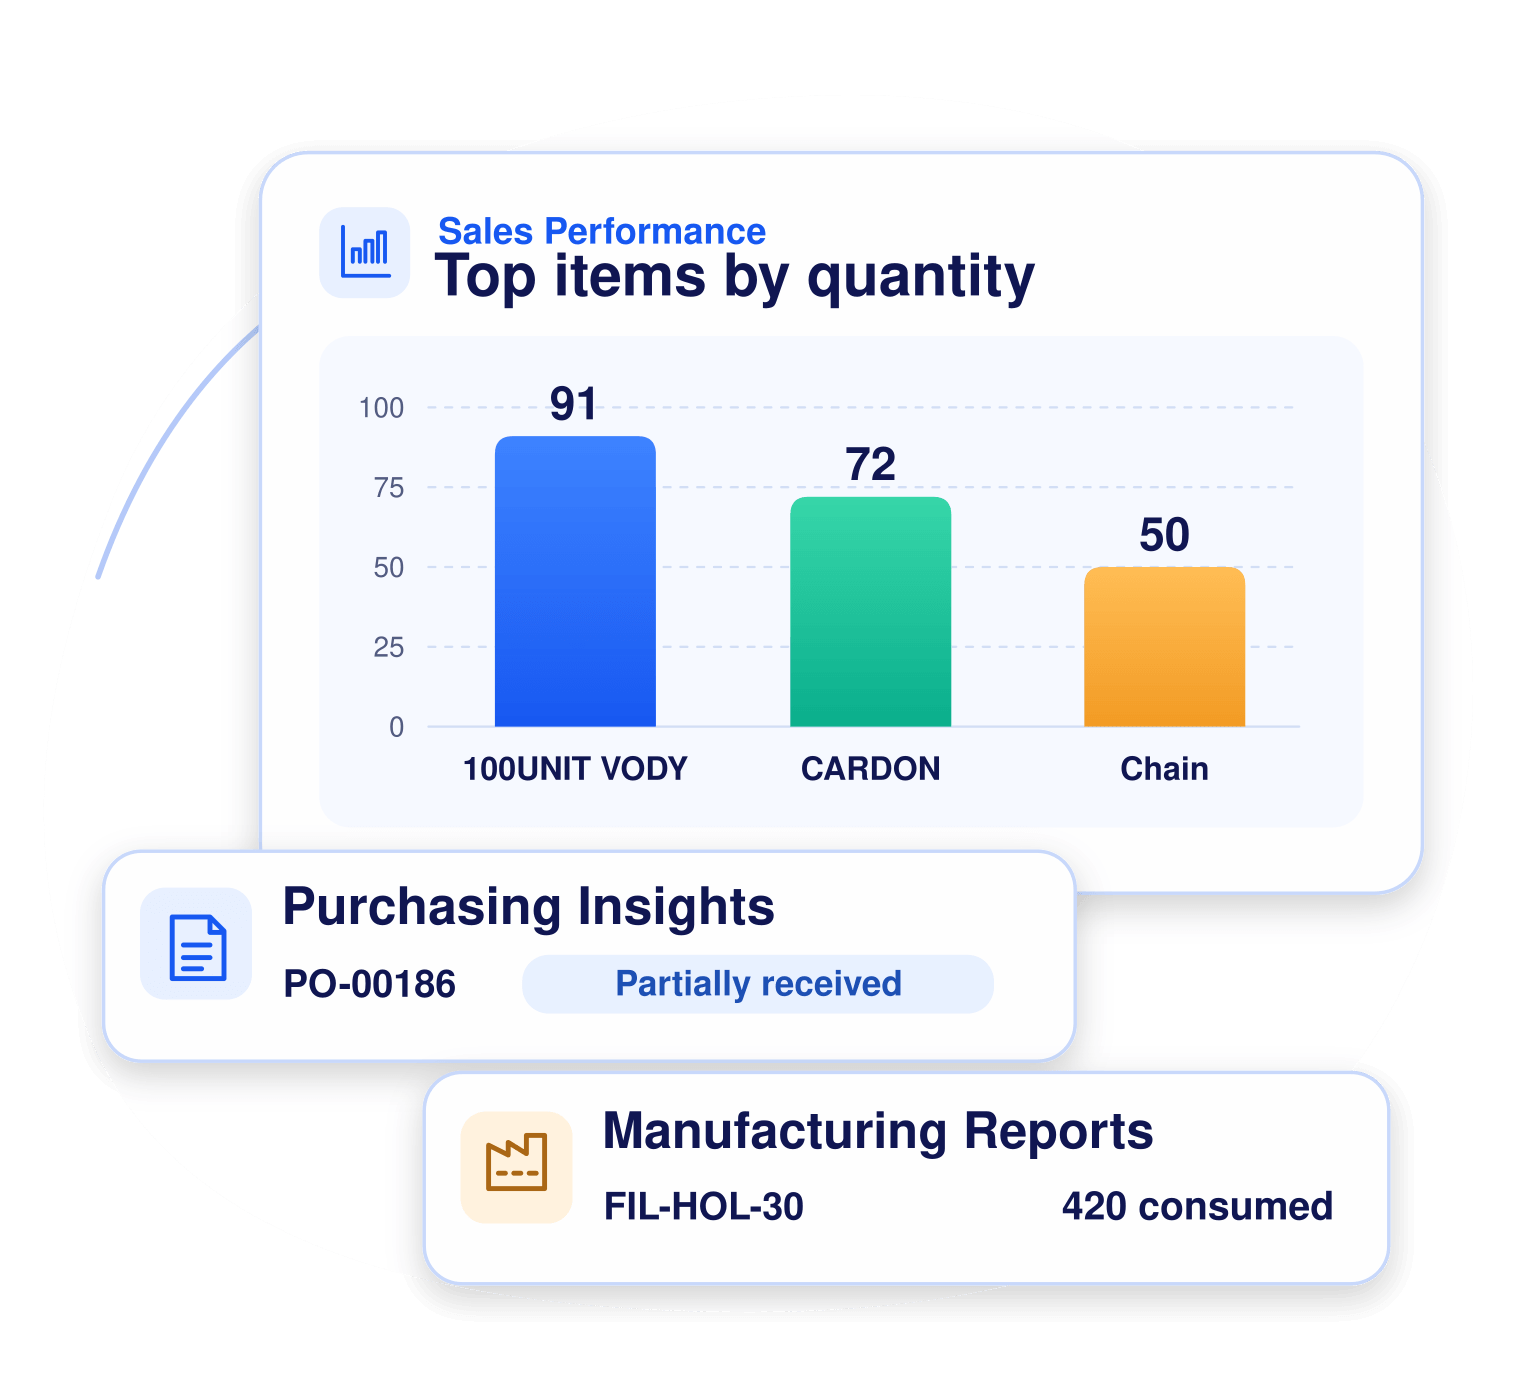
From best-selling products to purchasing activity and production costs, business reports provide a clearer view of the operations behind your results. Explore the information that matters across different areas of C2W Inventory.
Sales Performance
Product demand, sales activity, and customer purchasing trends.
Purchasing Insights
Supplier activity, purchase history, and order trends.
Manufacturing Reports
Production activity and material usage.
Inventory Cost & Value
Stock valuation and inventory cost information.
INTERACTIVE REPORTING & EXPORT
Explore Your Data, Your Way
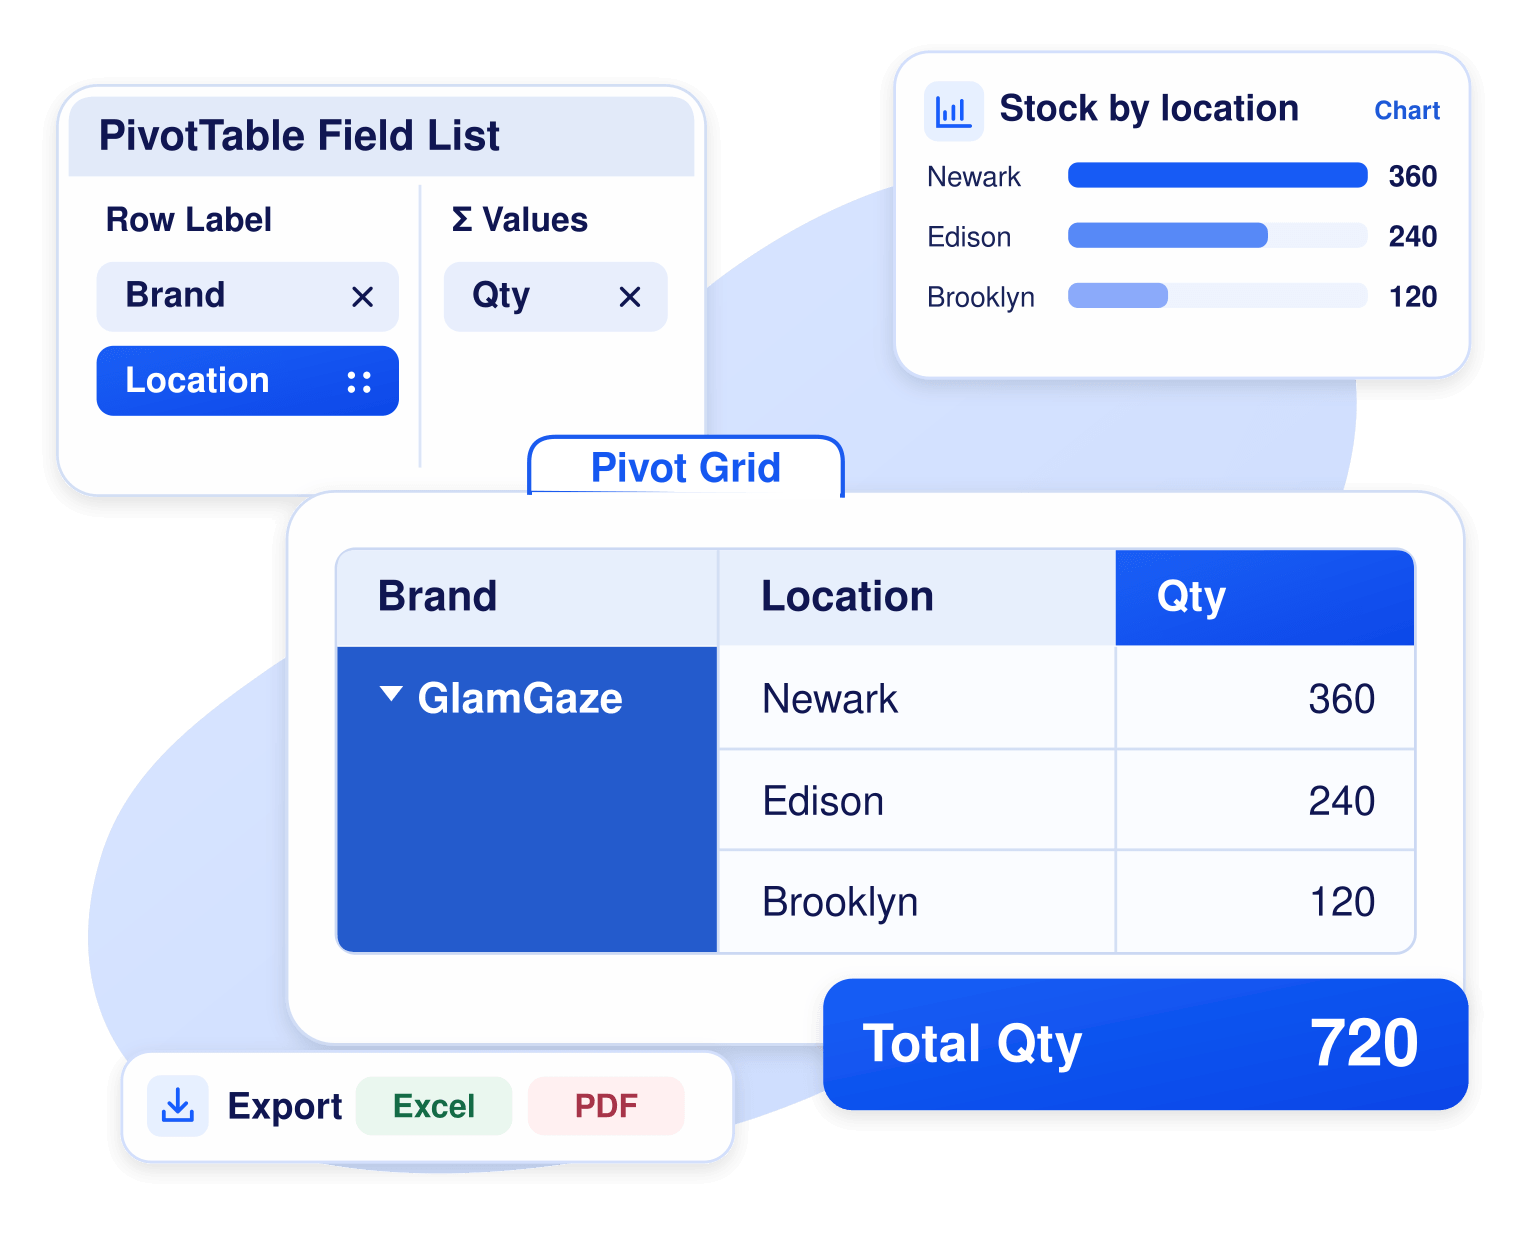
Go beyond static reports with Excel-like Pivot Grids and interactive charts built into the C2W Windows application. Organize, analyze, and visualize business data directly within the software, with flexible export options when needed.
Excel-like Pivot Table analysis
Work with report data directly in C2W, just like an Excel Pivot Table. Rearrange fields, group information, and summarize results without exporting to a spreadsheet.
Visual reporting with charts
Turn complex report data into clear visual insights to identify trends, compare performance, and spot patterns.
Excel and PDF export options
Export supported reports for further analysis, sharing, and business reviews.
EXPLORE MORE FEATURES
Discover More of C2W Inventory
Explore more tools to support your daily business operations.
REPORTING & DASHBOARD FAQS
Inventory reporting software organizes inventory quantities, costs, and transactions into reports that support business decisions. C2W Inventory combines inventory information with sales, purchasing, and other operational records.
C2W Inventory provides reports covering current stock, inventory costs, sales, purchasing, and other operational activities. Reporting options vary by business function.
C2W’s AI Report Assistant lets users describe the information they’re looking for in everyday language. It helps generate reports from supported business data without manually navigating report categories and filters.
Inventory quantities, stock movement, and purchasing history reveal where replenishment may be needed and where excess stock is accumulating. These insights support more accurate purchasing plans.
Sales reporting helps businesses evaluate sales order activity, product performance, and customer purchasing patterns to support inventory planning and sales decisions.
C2W Inventory supports Excel report exports, allowing businesses to work with reporting data in spreadsheets for analysis, sharing, and recordkeeping.
Get the Reports You Need to Grow
From inventory and sales to purchasing and manufacturing, C2W Inventory gives you the reports and analysis tools to understand your business and plan what’s next.
14 day free trial. No credit card required.